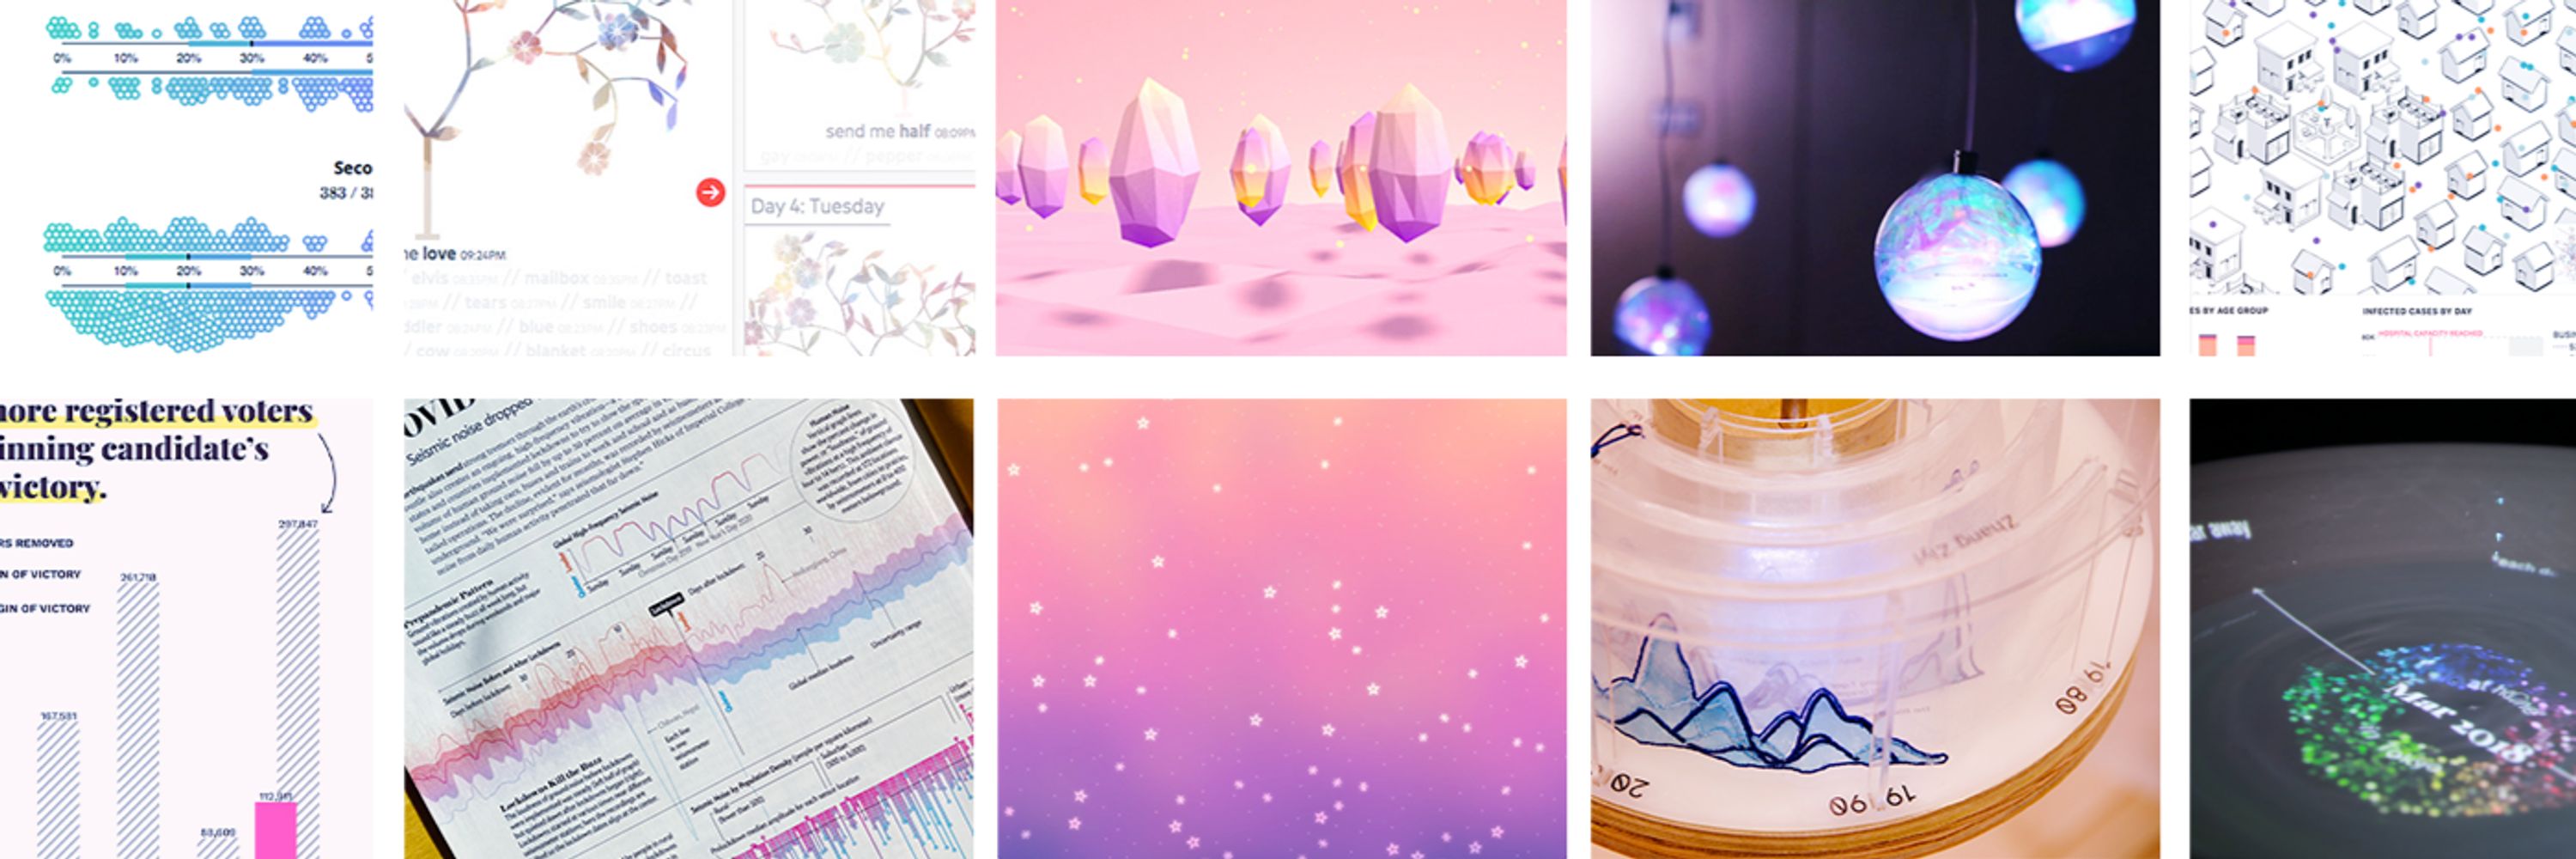
Shirley Wu
chinese-american artist, software engineer, dataviz designer, keynote speaker, published author && a work-in-progress learning to take up space ✨
🔗 shirleywu.studio
@watermeloncafe.bsky.social
I’m really loving tangerine juice and pomegranates these days. I’m an artist too Instagram.com/byalicelee but I mainly post about feelings + thoughts on feelings here
@jasonforrest.bsky.social
JasonForrestAgency.com, Data Vandals, Editor-in-chief of Nightingale, Electronic Musician, Ex-McKinsey. Contact & more: http://jasonforrestftw.com
@jasonforrestagency.bsky.social
We're on a mission to elevate how business communicates and understands data, tackling complex problems with innovative solutions. JasonForrestAgency.com
@ryanburgess.com
Photographer 📸 Engineering leader. Formerly Netflix & Evernote. Host of the @FrontEndHH podcast 🎙
@wattenberger.com
web dev, design, LLMs, data viz, tools for thought ✨ Design @ SHV 🌸 wattenberger.com
@stacylondon.bsky.social
principal front-end engineer - trello.com • panelist frontendhappyhour.com • previously: bitbucket.org • mostly musicophile, artist
@marisamorby.com
Research, design, art Connecting people with nature. Newsletter: https://marisamorby.kit.com/posts Ceramics shop: mm.gifts
@mpj.fff.dev
Data Engineer 💛 Creator of the YouTube show Fun Fun Function, writes weekly data development chronicle: funfun.email 🦁Previously @ Spotify & parity.io
@tiziana.bsky.social
Data art since 2010, collecting data since I was 4yo. Poetic Web. Data and generative artist turning sound and music into visuals. Lecturer, TEDx speaker, tizianaalocci.com | London based | IG: tiz.alocci | Founder of dataviz studio https://necessity.ink/
@jacqueschrag.com
Visual journalist and engineer at Axios. Builder of websites, data visualizations, and pixel cats. She/her.
@kanarinka.bsky.social
Hacker Mama/Artist/Designer/Coder/Writer/She/Ella Assoc Prof of Urban Science @MITdusp, Director, Data + Feminism Lab, Co-author #DataFeminism, hablo castellano
@moritzstefaner.bsky.social
Crafting data experiences at http://truth-and-beauty.net
@wattenberg.bsky.social
Human/AI interaction. ML interpretability. Visualization as design, science, art. Professor at Harvard, and part-time at Google DeepMind.
@lisacmuth.bsky.social
Creating & writing about data vis for @datawrapper.bsky.social.
@binx.bsky.social
climate tech, dataviz, scuba diving and cockatiels rachelbinx.com glitchclouds.com
@willchase.bsky.social
Designer, developer, and data person. Currently: Design at Observable. Formerly leading visual storytelling at Axios, and dataviz design at Fidelity 🏳️🌈 https://www.williamrchase.com/
@laurenfklein.bsky.social
Digital humanities, data science, AI, eating, professor of Quantitative Theory & Methods and English at Emory. Coauthor #DataFeminism w/ @kanarinka, PI #AIAInetwork.
@chezvoila.com
Information design and data visualization studio focused on the environment, social development, and governance. Montreal (since 2013). English and French Interactives, dashboards, reports, presentations, training Posts by Francis Gagnon, founder
@jburnmurdoch.ft.com
Columnist and chief data reporter the Financial Times | Stories, stats & scatterplots | john.burn-murdoch@ft.com 📝 ft.com/jbm
@fil.rezo.net
maps | data | code | journalism #D3 & #Observable 👁️🗨️ https://observablehq.com/@fil 🌍 https://visionscarto.net/
@yuri.is
Software engineer and data visualization enthusiast. Lives in Cambridge, Massachusetts, with no dogs.
@elijahmeeks.bsky.social
Principal Engineer at Confluent. Ex-Noteable, Apple, Netflix, Stanford. I write sometimes and talk too much.
@questionsindataviz.com
Dataviz blogger, author and Hall of Fame Tableau Visionary. Was @theneilrichards on here and the horrible other place. Data Fluency @JLL questionsindataviz.com https://routledge.pub/Questions-in-Dataviz
@infowetrust.com
Obsessed with data graphics. New book INFO WE TRUST https://linktr.ee/infowetrust
@pranavrajan.bsky.social
Machine Learning MSc @ KTH | Search + Information Retrieval, Visualization, and all things data and visual computing Interested in all things bach, piano, outdoors, data, cooking.
@tulpinteractive.com
Award winning Datavizioneer @ TULP interactive https://tulpinteractive.com
@driven-by-data.net
Senior Visual Data Journalist at @zeit.de. Co-founder and former CTO of @datawrapper.de. Former @nytimes.com graphics editor #datajournalism #graphics #maps #cartography (he/him)
@rodolfoalmd.nucleo.jor.br
bio.rodolfoalmeida.info ✹ visual journalist & information designer ✹ designing for @nucleo.jor.br & @sumauma.com ✹ researching climate crisis visualization with labvis/ufrj
@ameliaantzee.bsky.social
➡️ ameliaantzee.com ℹ️ Previously Trud Antzée 🌸 Antzée is pronounced an-TSEE 📈 Creative information designer 🎼 Former musician & teacher 🎧 Dancer & DJ of Argentine social tango ✏️ English and/or Norwegian nynorsk 🇳🇴 Oslo, Norway 💃🏻 She/her ⛔️ No AI
@hellopeiying.bsky.social
From Singapore 🇸🇬 Head & Co-Founder, Kontinentalist. Data storyteller. Chevening Scholar 23’, MSc Data, Inequality and Society at University of Edinburgh 🏴
@jerthorp.bsky.social
Artist, writer, educator, birder & nudibranch enthusiast. Author of Living in Data (MCDxFSG).
@amycesal.com
Freelance information designer and data viz consultant. 👩🏼🏫 Instructor @ MICA Data Analytics and Visualization grad program 📊 Product Evangelist @everviz https://www.amycesal.com
@nadiehbremer.com
Award-winning Data Visualization Designer & Data Artist | Founder of Visual Cinnamon | Graduated Astronomer ✨ | Author of "CHART" & "Data Sketches" | 🇳🇱 VisualCinnamon.com
@albertocairo.com
Designer, journalist, and professor. Author of 'The Art of Insight' (2023) 'How Charts Lie' (2019), 'The Truthful Art' (2016), and 'The Functional Art' (2012). NEW PROJECT: https://openvisualizationacademy.org/
@jenchristiansen.com
Graphics editor at Scientific American • Author of Building Science Graphics https://www.buildingsciencegraphics.com/ • Formerly at National Geographic
@cedricscherer.com
🧙♂️✨📊 Independent Data Visualization Designer, Consultant & Instructor | available for projects and workshops All things data & design with #rstats, #ggplot2, #Figma, #DataWrapper, #Flourish, and more Co-Founder of the #30DayChartChallenge
@amelia.mn
Associate professor of statistics and data science at the University of St Thomas. Into data visualization and reproducible research, obsessed with R. pronoun.is/she website: amelia.mn mastodon: @vis.social/@amelia
@visualisingdata.com
Independent data visualisation expert: Designer, consultant, trainer, lecturer, author, researcher, speaker, host of ‘Explore Explain’ podcast. 🇬🇧 in 🇮🇪 It’s all here http://visualisingdata.com/