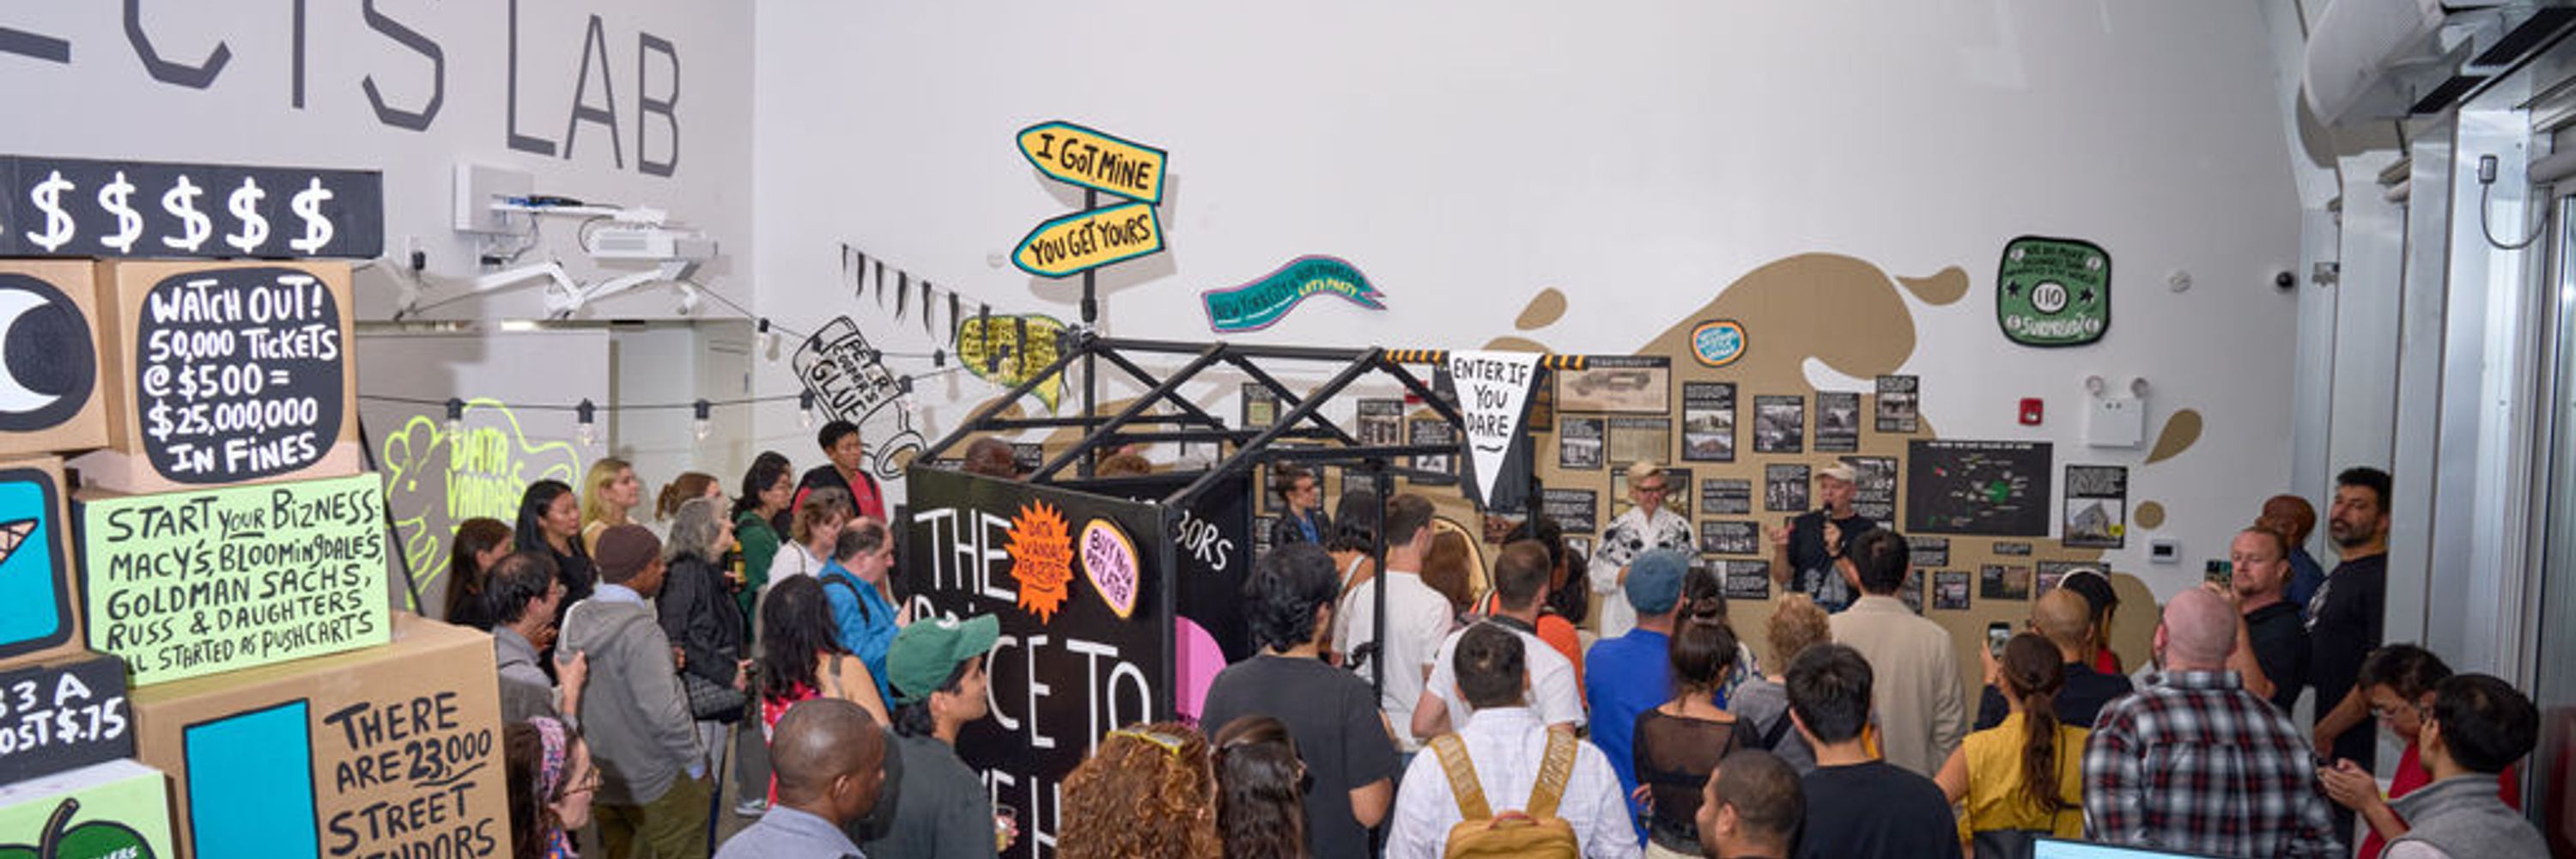
https://datavandals.com
The Data Vandals present data in exciting new ways, stopping people in their tracks and inviting them to learn more.
@dataandme.bsky.social
former 🥑 dev advocate @rstudio, 🏀 hoop head, data-viz lover, gnashgab, blatherskite, #rstats, doggos, and horses
@bellingcat.com
Bellingcat is an independent investigative collective of researchers, investigators and citizen journalists brought together by a passion for open source research. Want to support our charity? bellingcat.com/donate
@rjnskl.bsky.social
Data and visual journalist, New York Times climate team https://www.nytimes.com/by/mira-rojanasakul
@cybunk.bsky.social
Associate Professor in #SHS #Design #Dataviz #délibération at Telecom Paris / Institut Polytchenique de Paris Website : https://samuel-huron.github.io/ Last book : https://makingwithdata.org/ Views are my own.
@mapnavtom.bsky.social
Data Viz, Maps & GIS. Tech Writer for MapTiler. FOSS4G UK 2019 Co-Chair. Honorary Fellow of the University of Edinburgh GeoSciences. Views are all mine.
@datacitron.bsky.social
Data & information designer 🍋 Co-founder of the DataSuffragettes 🍋 Creative director of Nightingale, journal of datavizsociety 🍋 bobbaddict
@symbo1ics.bsky.social
Reviews: "unhinged", "deluded", "incoherent" | Black Lives Matter | Vidas Indígenas Importam | Trans Lives Matter | politics, profanity, analog electronics, retrocomputing, coffee, typography | REMOVE DOUG FORD | toma no cu,Elon | = @symbo1ics on Twitter
@gelliottmorris.com
i write a data-driven news and politics newsletter called Strength In Numbers: gelliottmorris.com/welcome wrote a book by the same name: bit.ly/3OWqEqR. formerly ABC News/538 & The Economist. proud custodian of a small community garden plot.
@scientificdiscovery.dev
Science writer and chart maker. Researcher at Our World in Data. Co-founder of Works in Progress. Newsletter: https://scientificdiscovery.dev https://twitter.com/salonium 🏳️🌈
@kazuhirokida.bsky.social
Data Editor @nikkei.com @asia.nikkei.com | Newsroom AI Initiatives Lead | The Lede Program @columbiajournalism.bsky.social alum https://linktr.ee/kazuhirokida
@curiousdata.bsky.social
Over-analyses TV series, music, my cat and Eurovision in #dataviz By day, data analyst at LinkedIn Tableau's #VizoftheDay three times, Top 10 in #Ironviz in 2021 Website: https://curiousdata.netlify.app/ She/her
@geovisual.bsky.social
visualization lecturer, researcher, developer. datavis, geovis, uncertainty vis. professor of media informatics and data visualization at university of applied sciences hamburg.
@danz68.bsky.social
A bit of everything, recreational math, mechanical engineer, programmer, statistics, dataviz.
@upshot.nytimes.com
Data, charts, analysis and games from The New York Times: nytimes.com/upshot
@visualizingeconomics.com
Making beautiful data visualizations about the economy since 2004, lurking on the internet since 1990.
@traversdata.bsky.social
You don't need a data background to make useful dashboards in Power BI... just a good teacher who makes it easy. https://www.traversdata.com
@chuckydee25.bsky.social
Analytics manager, dataviz enthusiast, always running after time... Background photo from Ulysses hotel in Baltimore https://www.hotelsone.com/baltimore-hotels-us/ulysses.fr.html
@vivizzi.bsky.social
📊 Information Designer and Data Analyst freelancer 📚 I used to publish books 🛼 now I roller skate a lot ✈️ Immigrant 📍Carioca em Lisboa #dataviz posts in EN, everything else in PT
@naelshiab.bsky.social
Senior data producer, CBC/Radio-Canada. Behind https://github.com/nshiab/simple-data-analysis and https://code-like-a-journalist.com/. More on https://naelshiab.com/.
@hellopeiying.bsky.social
From Singapore 🇸🇬 Head & Co-Founder, Kontinentalist. Data storyteller. Chevening Scholar 23’, MSc Data, Inequality and Society at University of Edinburgh 🏴
@cleverfranke.com
We pioneer through data, design and technology to unravel the world’s complexity. We connect people to data to empower insights, reveal new perspectives, and inspire change. cleverfranke.com Part of ADC Consulting 📊📈 #dataviz #datavisualization
@nicolas.kruchten.com
@vandeneeckhoutkoen.bsky.social
📊 Turning complex data into powerful visual stories! Author of 'Powerful Charts'. Ex-physicist. He/him 🏳️🌈
@d-qn.github.io
Data/Visual Journalist LeTemps🇨🇭 @letemps.ch | Lecturer #ddj AJM UniNE | #dataviz #rstats #datascience | Formerly Tamedia, Swiss Broadcasting Corporation, Quant, Genetics PhD | He/him Based in Lausanne, Switzerland
@datarevelations.com
Professional chart looker-atter. Author of "The Big Picture" and co-author of "The Big Book of Dashboards." James Jamerson disciple.
@coulsim.bsky.social
Gosseux d'données/pelleteux de cloud. Economist turned data scientist in the insurance industry. EN/FR #rstats en production #opendata blog: www.simoncoulombe.com github: simoncoulombe
@womenindataviz.bsky.social
A community of data visualization practitioners, learners, and enthusiasts. Learn more and join us: https://campsite.bio/womenindataviz
@merrykerry.bsky.social
Just here. Slowly dying. Personal Account. Not representative of any organisation. Interests in Dataviz / Intelligence / Philosophy / Psych / Linguistics / Cultural History / Knitting / Alpacas kerrykolosko.com grafiqinsights.com workoutwednesday.com
@isabelmeirelles.bsky.social
Information designer, professor OCAD University, author “Design for Information” (2013), co-founder @InfoPlusConf
@zanewolf.bsky.social
Freelance Data Designer Programs Director @ Data Viz Society She/they/whatever programs@datavisualizationsociety-dot-org BSs in Biology and Applied Physics, PhD in Organismic and Evolutionary Biology
@yuriengelhardt.bsky.social
Information Visualization 📊📉✍🏼 at University of Twente Core project: The Languages of Visualization, with Clive Richards Also at UT Climate Centre @utclimate.bsky.social LinkedIn: https://linkedin.com/in/yuriengelhardt Mastodon: https://vis.social/@yuri
@ivabrunec.bsky.social
data scientist in toronto / maps and dataviz / almost useless trivia knowledge https://ivabrunec.github.io/
@lajoiemedia.bsky.social
Professing data journalism at George Washington University's @SMPAGWU. Ex-@barronsonline, @CBCRadioCanada, @SCMP_News, @WSJ.
@showmydata.org
Founder of http://ShowMyData.org. Co-leader of http://TestMyBrain.org. Graph interpretation research: https://www.sciencefriday.com/segments/bar-graph/. Faculty @Wellesley.
@insightsmachine.bsky.social
I like talking about data visualisation and actionable insights in Power BI, and pushing for better vis & UI/UX. See my sample file here: https://bit.ly/3twlps8
@parabole.bsky.social
Data storytelling + information design expert⚡️Founder of Parabole Studio 📡 www.parabole.studio 👈
@emiliaruzicka.bsky.social
Data journalist, editor, designer, producer / Speaker at NICAR25 / UVA Grad Student / Writer for Data Viz Society / they/them
@shirleywu.studio
chinese-american artist, software engineer, dataviz designer, keynote speaker, published author && a work-in-progress learning to take up space ✨ 🔗 shirleywu.studio
@acotgreave.bsky.social
Tableau evangelist + data communicator. Newsletter: http://tabsoft.co/sweetspot Book: http://bigbookofdashboards.com LinkedIn: https://www.linkedin.com/in/acotgreave/
@nigelblue.bsky.social
explanation graphics; author (latest: Joyful Infographics, 2023); happy to be alive! new book coming soon