graphane
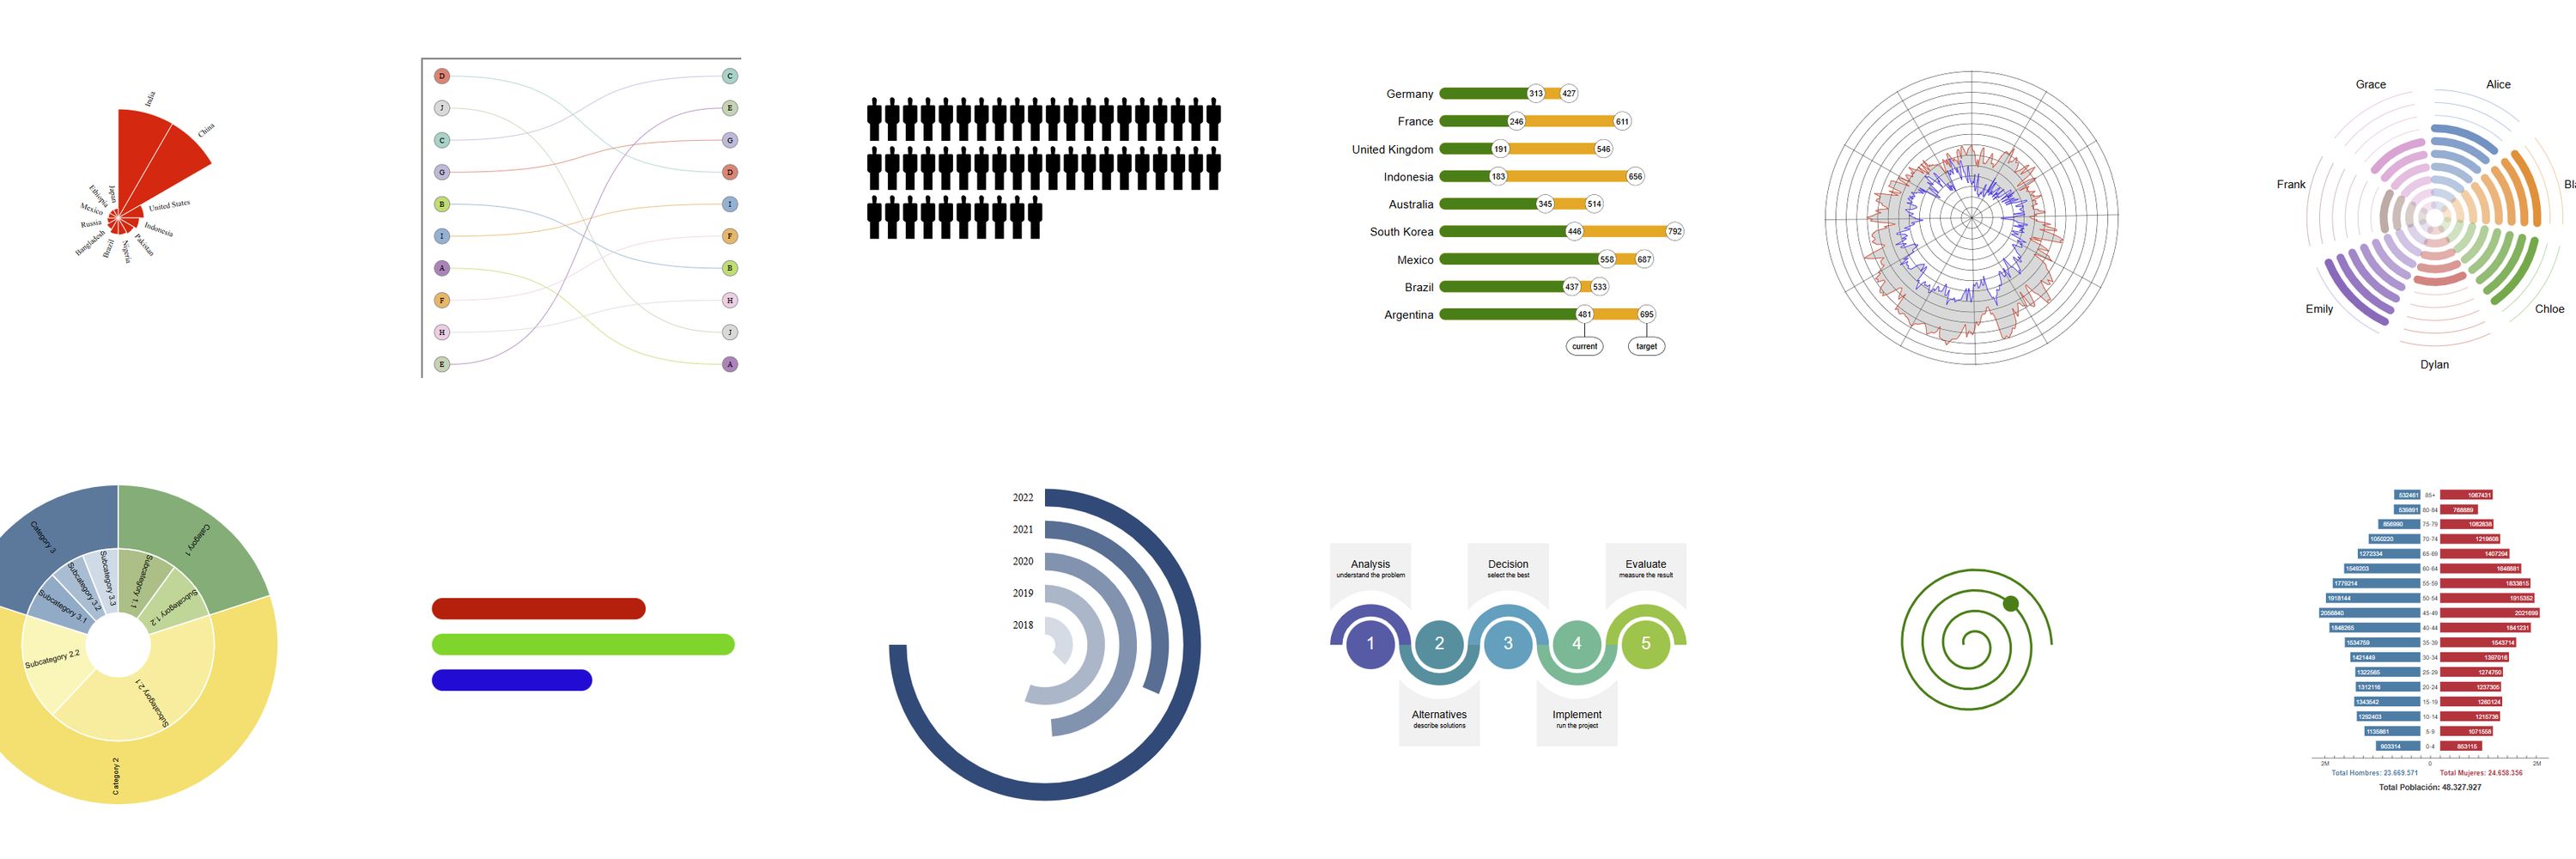
A simple, declarative, reactive, and high performance data visualization microframework
- documentation : https://www.graphane.dev/
- examples and playground: https://playground.graphane.dev/
@elimeixler.ft.com
Hoping this place is better than the last one. @financialtimes.com Asia world news editor in 🇭🇰, bagel dogmatist. Usual business, DM’s open
@morgangray.bsky.social
Quantitative Ecologist (she/her) What: wildlife | connectivity | climate | conservation How: statistics | R | dataviz | maps
@mtjhrsk.bsky.social
just asking questions! surveys, data, R and stuff at ALDE Party. likes = (mostly) bookmarks. Profile pic: Hedi Mertens.
@mluczak.bsky.social
Chair in Complexity Science & Professor of Informatics, Victoria University of Wellington; co-director @tepunahamatatini.bsky.social; complex systems, emergence, information dynamics, computational social science; https://complexity.wgtn.ac.nz
@tepunahamatatini.bsky.social
The Aotearoa New Zealand Centre of Research Excellence for complex systems. Turning complexity into possibility.
@hackette7.bsky.social
Director Arena for Journalism in Europe https://journalismarena.eu/, Lecturer Gothenburg University https://www.gu.se/en/about/find-staff/brigittealfter2 Journalist http://www.alfter.dk/ Posting on journalism, Europe, collaborative journalism
@danahajek.bsky.social
Data Journalist @ Zeit Online, before: Frankfurter Allgemeine Zeitung Alumna 2020 @ City, London University
@jasonforrest.bsky.social
JasonForrestAgency.com, Data Vandals, Editor-in-chief of Nightingale, Electronic Musician, Ex-McKinsey. Contact & more: http://jasonforrestftw.com
@conradhackett.bsky.social
Demography nerd at Pew Research Center Global religious change, sociology
@wedodata.bsky.social
L'agence Dataviz 🇫🇷 / nous vous aidons à raconter vos données // #data #viz & #dataviz // Newsletter 💌 Buena Vista Data Club 💌 http://wedodata.fr/newsletter
@laurenfklein.bsky.social
Digital humanities, data science, AI, eating, professor of Quantitative Theory & Methods and English at Emory. Coauthor #DataFeminism w/ @kanarinka, PI #AIAInetwork.
@crystaljjlee.com
Writing about tech, power, data visualization, social media, disability. Assistant prof of computational media @ MIT. 🇹🇼 crystaljjlee.com
@arnicas.bsky.social
Into creative ML/AI, NLP, data science and digital humanities, narrative, infovis, games, sf & f. Consultant, ds in Residence at Google Arts & Culture. (Lyon, FR) Newsletter arnicas.substack.com.
@maxroser.bsky.social
— Founder of Our World in Data — Professor at the University of Oxford Data to understand global problems and research to make progress against them.
@kellyhereid.bsky.social
Climate scientist, geologist, and catastrophe modeler, Liberty Mutual. Posts on all things hurricane, wildfire, flood, earthquake, tornado. Sassy takes are mine not employer's. 📍Oakland, CA Website: hereidk.strikingly.com
@jenchristiansen.com
Graphics editor at Scientific American • Author of Building Science Graphics https://www.buildingsciencegraphics.com/ • Formerly at National Geographic
@daniellealberti.bsky.social
Axios managing editor for data viz, previously at Pew Research My favorite things are quilts, birds, books and maps
@binx.bsky.social
climate tech, dataviz, scuba diving and cockatiels rachelbinx.com glitchclouds.com
@thomasp85.com
Visualisation and graphics @posit.co Classic Generative Art Weirdo using 🖤 and R: http://thomaslinpedersen.art and http://deca.art/thomasp85 he/him
@rjnskl.bsky.social
Data and visual journalist, New York Times climate team https://www.nytimes.com/by/mira-rojanasakul
@a11yawareness.bsky.social
Helping you better understand web accessibility for people with disabilities. Created by @patrickmgarvin.bsky.social.
@infobeautiful.bsky.social
Data visualizations & information graphics by David McCandless. Plus favourite finds & graphics from around the web. Making sense of the world - well, trying to - since 2009. https://linktr.ee/infobeautiful
@kanarinka.bsky.social
Hacker Mama/Artist/Designer/Coder/Writer/She/Ella Assoc Prof of Urban Science @MITdusp, Director, Data + Feminism Lab, Co-author #DataFeminism, hablo castellano
@higsch.com
| Husband & dad^3 | head data & visualizations at @spiegel.de | #Svelte and #D3 | biochemistry & computational biology PhD | 🇸🇪🇩🇪🇪🇺 | https://spiegel.de/duv | https://higsch.com
@claradealberto.bsky.social
Infographisme @LePoint, passée par Libé, Le Monde et WeDoData // Une des moitiés de GoumProd // J’aime beaucoup les cartes
@nadiehbremer.com
Award-winning Data Visualization Designer & Data Artist | Founder of Visual Cinnamon | Graduated Astronomer ✨ | Author of "CHART" & "Data Sketches" | 🇳🇱 VisualCinnamon.com
@frank.computer
PhD candidate and researcher in HCI. I care a lot about accessible data interaction 📊 (: Disabled and getting into trouble. Presently at @hcii.cmu.edu. Formerly: Adobe, Highsoft, Apple, Visa, + others. He/him www.frank.computer
@datawrapper.de
Enrich your stories with charts, maps, and tables – interactive, responsive, and on brand. Questions? Write us: datawrapper.de/contact-us
@unamandita.bsky.social
Graphics editor at Scientific American. Medical illustrator-turned-datavizzer, New Yorker, parent. She/her. These views are mine, get your own. https://amandamontanez.com/
@stephanietuerk.bsky.social
I design and develop interfaces for data at [redacted (public policy)]. Past lives in arch/history of arch. Generally interested in: ∩ of data/image/language; history of most things; frontend dev/web/TS; learning; dad jokes. Camberville, MA
@bastianherre.bsky.social
Researcher @ourworldindata.org. I make research on democracy, human rights, armed conflict, and violence easier to access and understand. he/him
@do.minik.us
generative artist, data visualization developer, identity-challenged dataviz: https://do.minik.us art: https://dominikus.art
@juruwolfe.bsky.social
Americas editor, @graphics.reuters.com. Once: FiveThirtyEight, CUNY adjunct. Almost Canadian.
@mhernandez.bsky.social
Graphics Editor at The New York Times 🇺🇸| former Reuters 🇸🇬 | South China Morning Post 🇭🇰 | La Nacion 🇨🇷
@eagereyes.org
Interested in all things visual and data, like data visualization. ISOTYPE collector, synth dabbler, runner.
@shirleywu.studio
chinese-american artist, software engineer, dataviz designer, keynote speaker, published author && a work-in-progress learning to take up space ✨ 🔗 shirleywu.studio
@datacitron.bsky.social
Data & information designer 🍋 Co-founder of the DataSuffragettes 🍋 Creative director of Nightingale, journal of datavizsociety 🍋 bobbaddict
@simonrogers.bsky.social
Datajournalist & Data Editor @Google, Was @Twitter @Guardian. Co-host with Alberto Cairo http://datajournalismpodcast.com
@tonyvisualizes.bsky.social
Loves data, design and #dataviz 📊 🎨 Old-skool Gamer 🕹👾 Proud to play with Lego ✌ Interested in AI 🤖, news and (geo)politics 🌍 Post mostly in Dutch, sometimes in English # 867.376
@viegas.bsky.social
Human/AI Interaction and data visualization. Professor at Harvard. Co-founder of Google's People+AI Research initiative (PAIR)
@brrosenau.bsky.social
design enthusiast | tableau visionary | iron viz finalist '23 | ✈️🐠🥁📊 Internet Shenanigans: https://linktr.ee/brrosenau
@ladataviz.com
▵ Making your data visualization workflow easier: ladataviz.com ▵ Uncharted Area, a newsletter about building a two-people company in data visualization: newsletter.ladataviz.com ▵ Figma to Tableau Plugin: http://bit.ly/Figma2Tableau
@insightsmachine.bsky.social
I like talking about data visualisation and actionable insights in Power BI, and pushing for better vis & UI/UX. See my sample file here: https://bit.ly/3twlps8
@jhilden.bsky.social
Information designer from Helsinki. Co-founder of Koponen+Hildén Co-author of the Data visualization handbook / Tieto näkyväksi (Finnish edition)
@showmydata.org
Founder of http://ShowMyData.org. Co-leader of http://TestMyBrain.org. Graph interpretation research: https://www.sciencefriday.com/segments/bar-graph/. Faculty @Wellesley.